Written by Oghenetega Denedo✏️
Heatmaps are frequently employed in visualizing data to illustrate the concentration and spread of data, within a dataset. They use colors to demonstrate fluctuations in data values, allowing users to identify patterns, trends, and anomalies in datasets easily.
Developing these heatmaps requires a capable library. While options like Heatmap.js are popular, the newer Heat.js library is gaining traction for its advancements and built-in beneficial features.
This tutorial will explore the application of heatmaps in JavaScript projects, focusing on how to use the Heat.js library to generate them. Also, we’ll explore the functionalities of Heat.js, including integration strategies and best practices, to help you effectively implement heatmaps in your projects.
So, let's get started!
Overview of Heat.js and Heatmap.js
Both Heat.js and Heatmap.js are capable JavaScript libraries for creating heatmaps. They offer simple APIs for visualizing your data on the web. So let’s review both libraries, highlighting their features, differences, and suitability for various applications.
Heat.js
Heat.js provides developers with a user-friendly API to incorporate heatmaps into their applications. You can showcase heatmaps in various forms with Heat.js, including maps and graphs.
Customizing the appearance of the heatmaps is easy thanks to Heat.js’ inbuilt color schemes and the option to use customized CSS that aligns with your project’s design preferences. Additionally, Heat.js enables you to export data in formats like CSV, JSON, XML, and TXT for use in other applications.
Heat.js also accommodates over 50 languages, making it inclusive for people worldwide. In addition to that, it supports efficiently updating heatmaps in time to keep up with evolving datasets, a feature commonly needed in applications today.
Heatmap.js
Heatmap.js is recognized as a highly capable and widely-accepted library in the JavaScript community. It presents itself as a top-tier heatmap library that ships a rendering engine capable of handling over 40,000 data points with impressive speed.
It’s widely appreciated for its reliability and effectiveness, making it a popular choice for purposes such as generating representations, monitoring user interactions, and facilitating accurate and interactive heatmap presentations in geographical maps.
In the end, the library you choose will be based on your needs and limitations, within your project. However, this article will mainly focus on Heat.js, as it’s more recent and actively maintained.
Getting started with Heat.js
Now that we've gained an understanding of Heat.js and its advantages, let's jump into the process of getting started with integrating Heat.js into your web applications.
Installation and setup
Installing Heat.js in your project is quite simple. You have the option to add Heat.js to your project either by using a script tag or by utilizing the JavaScript package through package managers such as npm or yarn.
To keep the focus on Heat.js in this article, we will integrate the library using a script tag instead of installing its npm package. This way, we can avoid dealing with the intricacies of setting up build tools like webpack or esbuild.
Let’s get started by setting up the project directory. In your terminal, enter the commands below:
mkdir heatmap-demo
cd heatmap-demo
Within the heatmap-demo directory, create a new file called index.html and include the following code:
<!DOCTYPE html>
<html lang="en">
<head>
  <meta charset="UTF-8">
  <meta name="viewport" content="width=device-width, initial-scale=1.0">
  <title>Heat.js Demo</title>
</head>
<body>
  <h1>Heat.js Demo</h1>
</body>
</html>
Following that, we'll add the CDN links for the Heat.js JavaScript code and styles in the <head> section:
<!-- ... -->
<link rel="stylesheet" href="https://cdn.jsdelivr.net/npm/jheat.js@2.7.1/dist/heat.js.min.css">
<script src="https://cdn.jsdelivr.net/npm/jheat.js@2.7.1/dist/heat.min.js"></script>
<!-- ... -->
With that, we've successfully set up the Heat.js library in the project. Next, we'll discuss how to create a basic heatmap.
Creating a basic heatmap
The first step to creating a heatmap with Heat.js is to add the container element that will be bound by Heat.js to set up the heatmap.
Add the following code within the <body> section of the index.html file just below the heading text:
<!-- ... -->
<div id="heat-map-1"
  data-heat-options="{'descriptionText': 'A basic demo of heatmaps with Heat.js'}">
</div>
<!-- ... -->
In the code above, we created the container element with an id of heat-map-1 for Heat.js to render the heatmap visualization. The data-heat-options attribute contains the configuration object for setting up the heatmap. Here, we’ve only added the descriptionText option to set a visible description that adds context about the heatmap.
Next, let’s add the JavaScript code for rendering the heatmap. At the end of the <body> section, include the following code:
<script src="./script.js"></script>
Within the same directory as the index.html, create a script.js file and add the code below:
document.addEventListener("DOMContentLoaded", function () {
  let date = new Date(new Date().getFullYear(), 0, 1);
  for (let dayNumber = 0; dayNumber < 8000; dayNumber++) {
    let daysToIncrease = Math.floor(Math.random() * 500),
      newDate = new Date(date);
    newDate.setDate(newDate.getDate() + daysToIncrease);
    $heat.addDate("heat-map-1", newDate, null, false);
  }
  $heat.refreshAll();
});
Here's a breakdown of how the heatmap is rendered:
- When the DOM is fully loaded, the callback function kicks in
- The callback starts by setting up a date object that represents the day of the year. Then it goes through a loop 8000 times randomly selecting up to 500 days to add to the base date
- To finalize, we use the
$heat.addDate()function to include this new date in the heatmap - Once all dates are added, we refresh the heatmap by calling
$heat.refreshAll()to display all added dates on it
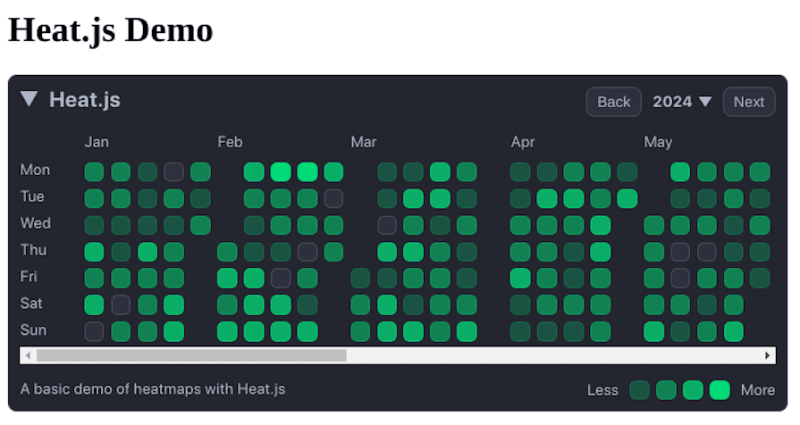
When you open the index.html file on your web browser, you should see a heatmap similar to the one shown below:  It's interesting how Heat.js resembles the GitHub contribution graph, isn't it? The way it works is by organizing and displaying data as a time series dataset. In this dataset, each entry includes a date matched with a count or frequency which influences the color intensity of each data point.
Customizing the appearance of the heatmap
After generating a heatmap using Heat.js, you might consider tweaking its look and feel to align it closely with the design of your application. Heat.js offers customization options that enable you to modify the visual elements of the heatmap.
One popular way to personalize your heatmap is by changing the color gradient that shows the intensity of the data points. With Heat.js, you can create a color gradient with compatible colors using CSS.
Let’s customize the color gradient in a new custom.css file:
:root {
  --heat-js-day-color-1-background-color: rgba(128, 0, 128, 0.25);
  --heat-js-day-color-1-border-color: rgba(128, 0, 128, 0.15);
  --heat-js-day-color-1-text-color: var(--heat-js-color-white);
  --heat-js-day-color-2-background-color: rgba(152, 0, 182, 0.5);
  --heat-js-day-color-2-border-color: rgba(128, 0, 128, 0.25);
  --heat-js-day-color-2-text-color: var(--heat-js-color-white);
  --heat-js-day-color-3-background-color: rgba(128, 0, 128, 1);
  --heat-js-day-color-3-border-color: rgba(198, 0, 198, 0.5);
  --heat-js-day-color-3-text-color: var(--heat-js-color-black);
  --heat-js-day-color-4-background-color: rgba(255, 0, 255, 0.75);
  --heat-js-day-color-4-border-color: rgba(255, 0, 255, 0.75);
  --heat-js-day-color-4-text-color: var(--heat-js-color-black);
}
Each color is defined with its background color, border color, and text color. These variables are prefixed with heat-js-day-color- followed by a number to specify the intensity level of the data points.
After customizing the color gradient, we need to link the custom.css file to our HTML document. In the <head> section of your HTML file, add the following line after the last CSS file that was linked:
<link rel="stylesheet" type="text/css" href="custom.css">
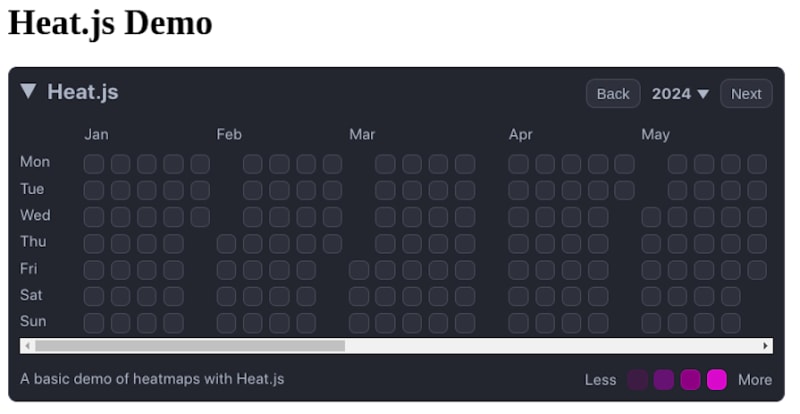
In the image below, you can see how the color gradient has been adjusted according to the custom color values defined in the custom.css file:  You can find additional themes in light and dark modes within the
 themes folder of the Heat.js GitHub repository.
Rendering dynamic data from an API
The Heat.js example we presented earlier may not reflect what you'd typically face in a real-world scenario that involves user data. So now, let’s dive in and set up a heatmap that displays a user's GitHub contributions to learn how to work with dynamic data with Heat.js over time. We'll fetch the data using GitHub’s GraphQL API.
First, you’ll need to obtain a personal access token to fetch the contribution data from the GitHub API. Once you have the personal access token, go to the script.js file and replace its contents with the following:
const githubPersonalAccessToken = "<your_github_personal_access_token>";
const githubUserName = "<your_github_username>";

async function fetchContributionData() {
  const query = `
    query {
      user(login: "${githubUserName}") {
        contributionsCollection {
          contributionCalendar {
            weeks {
              contributionDays {
                date
                contributionCount
              }
            }
          }
        }
      }
    }
  `;
  try {
    const response = await fetch("https://api.github.com/graphql", {
      method: "POST",
      headers: {
        "Content-Type": "application/json",
        Authorization: `Bearer ${githubPersonalAccessToken}`,
      },
      body: JSON.stringify({ query }),
    });
    if (!response.ok) {
      throw new Error(`HTTP error! status: ${response.status}`);
    }
    const data = await response.json();
    // Extract contribution data
    data.data.user.contributionsCollection.contributionCalendar.weeks.forEach(
      (week) =>
        week.contributionDays.forEach((day) => {
          const contributionDate = new Date(day.date);
          const contributionCount = day.contributionCount;
          $heat.updateDate("heat-map-1", contributionDate, contributionCount);
        })
    );
  } catch (error) {
    console.error("Error fetching contribution data:", error);
    throw error;
  }
}
document.addEventListener("DOMContentLoaded", async function () {
  await fetchContributionData();
  $heat.refreshAll();
});
This code does a lot, but let’s break it down:
- We set up the access token and username for GitHub to interact with the API and fetch contribution data
- Next, we define a function called
fetchContributionData()to asynchronously retrieve contribution data from the API. It constructs a GraphQL query to pull data such as the user's contribution dates and counts from it - After fetching the contribution data, it compiles the count of the contributions, for each day. Then it uses
$heat.updateDate()to update the heatmap with this contribution information - To ensure that all updates are displayed once all contribution data is loaded, we call the
$heat.refreshAll()function
When you head back to your browser, your heatmap will look something like the one shown in the image below:  You might be wondering why your contribution data isn’t reflected in the heatmap. This is because the count value Heat.js uses to color each grid block is relatively higher than what’s coming from your contribution data. There’s an easy fix for this — go to the
 script.js file and add the following code:
function bindingOptions() {
  return {
    colorRanges: [
      {
        minimum: 1,
        cssClassName: "day-color-1",
        mapCssClassName: "day-color-1",
        chartCssClassName: "chart-color-1",
        statisticsCssClassName: "statistics-color-1",
        tooltipText: "Day Color 1",
        visible: true,
      },
      {
        minimum: 3,
        cssClassName: "day-color-2",
        mapCssClassName: "day-color-2",
        chartCssClassName: "chart-color-2",
        statisticsCssClassName: "statistics-color-2",
        tooltipText: "Day Color 2",
        visible: true,
      },
      {
        minimum: 5,
        cssClassName: "day-color-3",
        mapCssClassName: "day-color-3",
        chartCssClassName: "chart-color-3",
        statisticsCssClassName: "statistics-color-3",
        tooltipText: "Day Color 3",
        visible: true,
      },
      {
        minimum: 8,
        cssClassName: "day-color-4",
        mapCssClassName: "day-color-4",
        chartCssClassName: "chart-color-4",
        statisticsCssClassName: "statistics-color-4",
        tooltipText: "Day Color 4",
        visible: true,
      },
    ],
    descriptionText: "A basic demo of heatmaps with Heat.js",
  };
}
We’ve updated the color ranges for the heatmap grids, with each range determined by a minimum contribution count and associated CSS class names, tooltip text, and visibility status.
Next, we’ll need to update the Heat.js configuration object in the index.html file to use the binding options we defined in the script.js file:
<div id="heat-map-1" data-heat-options="bindingOptions"></div>
Now, if you recheck your browser, the contribution data will be properly shown on the heatmap.
Best practices for creating heatmaps with Heat.js
Creating effective heatmaps for your project goes beyond displaying data. You need to thoughtfully evaluate different factors to guarantee clarity, precision, and a good UX. Here are some general guidelines to follow while creating heatmaps with Heat.js:
- Smart color choices: When creating your heatmap, avoid using colors that might look impressive but could confuse users. You’re using the heatmap to communicate data, so use color gradients that clearly illustrate that story. For example, to display range of data values, you could use a color gradient such as red-to-yellow-to-green for high-to-medium-to-low values. You should also test your color scheme choices using color blindness simulators, like Coblis color blindness simulator to make sure they are accessible to users with color blindness issues.
- Proper labeling: To help users interpret data more accurately, clearly define the title, legend, and any necessary annotations within the heatmap. This will help provide important context to ensure that users can understand your data
- Responsiveness and device compatibility: When creating a heatmap, make sure it is responsive enough for users to view on mobile devices. Also, be sure to test it across browsers to ensure the look and functionality are consistent
- Interactivity and user engagement: Integrate tooltips into your heatmap to enhance the user experience by revealing more context on hover. Heat.js offers customization options for tooltips, allowing you to display additional information
By following these best practices, you can leverage Heat.js to create informative and user-friendly heatmaps that effectively communicate insights from your data.
Conclusion
When it comes to creating an effective heatmap, remember that it's more than just plotting data points. Leverage a library like Heatmap.js to select precise data, use accurate and visually helpful colors, and label your heatmap clearly enable you to turn data into insights that matter.
Thanks for taking the time to read this guide to creating heatmaps with JavaScript and Heat.js. Cheers!
Are you adding new JS libraries to build new features or improve performance? What if they’re doing the opposite?
There’s no doubt that frontends are getting more complex. As you add new JavaScript libraries and other dependencies to your app, you’ll need more visibility to ensure your users don’t run into unknown issues.
LogRocket is a frontend application monitoring solution that lets you replay JavaScript errors as if they happened in your own browser so you can react to bugs more effectively.
LogRocket works perfectly with any app, regardless of framework, and has plugins to log additional context from Redux, Vuex, and @ngrx/store. Instead of guessing why problems happen, you can aggregate and report on what state your application was in when an issue occurred. LogRocket also monitors your app’s performance, reporting metrics like client CPU load, client memory usage, and more.
Build confidently — start monitoring for free.


Top comments (0)